
Start with a ratio, then check the cash calendar.
For a company using cash at a steady rate, simple cash runway equals available cash divided by positive monthly net cash burn. If you have $600,000 available and use $60,000 a month after operating cash receipts, the estimate is 10 months. When collections, hiring, investment or repayments change, project cash month by month instead.
Runway estimates how long the current cash can support the plan. It is a forecast built from assumptions, not a promise that the bank will stay positive until a particular date. A monthly average can hide a payroll payment that arrives before a large customer collection.
Carta’s startup metrics glossary relates runway to burn and explains that changing the rate changes the estimate. The calculations below use an explicit cash basis: cash collected and cash paid, rather than treating booked revenue as money already in the bank. All company figures and scenarios here are fictional.
1. Confirm the cash you can use.
Choose an as-of date and one reporting currency. Reconcile the relevant bank and cash balances. Identify any cash that is restricted or unavailable for the operating plan, rather than combining it with ordinary spending cash.
In our fictional example, the bank balances total $660,000. Of that, $60,000 is unavailable for ordinary operations. The starting available cash is therefore $600,000. The team also chooses a $100,000 minimum operating cash floor for planning. That floor is a management assumption, distinct from the unavailable cash.
Use one consistent treatment. Here, the $100,000 remains inside the $600,000 opening balance, and the forecast tests when closing cash drops below it. For a simple “time to floor” calculation, subtract it once: ($600,000 − $100,000) ÷ monthly burn. Do not subtract it from opening cash and then test against the same floor again.
Do not count an unsigned funding intention, a hoped-for grant or an uncollected invoice as current cash. Show potential funding in a separate scenario with its own amount, timing and conditions. For a credit facility, distinguish cash already drawn from financing that may be available subject to its terms.
2. Define the burn rate and its period.
Use a representative period, and explain what you include. In this guide, operating net cash burn = operating cash paid − operating cash collected. Positive burn means that operating activity uses cash. Financing receipts are excluded so that a new raise does not conceal the cash used to operate.
| Measure | Amount | Meaning here |
|---|---|---|
| Operating cash paid | $110,000 | Cash leaving for the recurring operating plan. |
| Operating cash collected | $50,000 | Customer cash actually received in the period. |
| Operating net cash burn | $60,000 | $110,000 − $50,000. |
| Simple runway to zero | 10.0 months | $600,000 ÷ $60,000, assuming the pattern stays constant. |
| Simple time to the chosen floor | 8.3 months | ($600,000 − $100,000) ÷ $60,000, rounded. |
The last two estimates assume an evenly paced, constant net outflow and no other cash movements. They are useful starting points. They cannot tell you whether a payment due next week comes before the cash receipt expected next month.
If you average historical burn, state the months and separate unusual movements. A three month average is not automatically better than the latest month. If a planned hire changes payroll next month, the historical average will miss that change. Keep the actual cash reconciliation, the recurring operating view and the complete forward cash plan distinct.
Accounting profit, MRR and cash collected are different measures. An annual customer payment can improve this month’s cash while creating service obligations for later months. A recognized sale with later payment may increase revenue without improving today’s cash. Build the forecast around payment timing and keep the relevant revenue and expense assumptions alongside it.
Try the simple calculation.
Use the same currency for all four values. This public calculator assumes the same operating receipts and payments every month and no other cash movements. Values are used on this page; no account is needed. Use the monthly worksheet below for changes and one-off items.
When receipts equal or exceed payments, the ratio does not give a finite depletion runway under these assumptions. That does not establish unlimited runway: future costs, receipt timing and other cash movements can still create a funding need.
3. Forecast the month in which cash crosses a threshold.
Use a cash roll-forward for each month:
Closing cash = opening cash + operating receipts − operating payments − other cash outflows + financing receipts.
The next month’s opening cash equals this month’s closing cash. Track other cash inflows separately if the company has them.
Add hiring dates and fully loaded cash costs, collection dates, annual payments, capital purchases, loan repayments and other material movements. Ensure that each payment appears once. If taxes or a supplier payment are already inside operating payments, do not add them a second time as another outflow.
Use a base case without unreceived funding. Then compare a financing case with the proceeds in the month they are assumed to arrive. A positive closing balance created by a future raise is conditional on that financing. It is different from runway supported by cash already available.
A fictional plan changes the result.
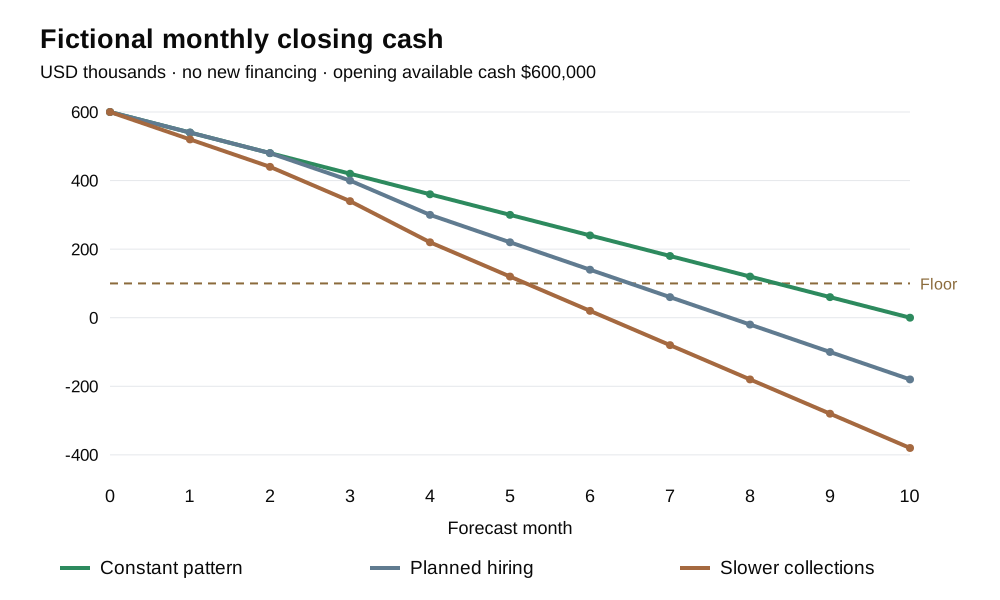
Northstar starts with $600,000 available. It collects $50,000 a month and pays $110,000 for the first two months. From month 3, planned hiring lifts operating payments to $130,000. A one-off $20,000 payment falls in month 4. No new financing is included.
That plan closes month 6 with $140,000, month 7 with $60,000 and month 8 with a projected $20,000 shortfall. The first month-end below the $100,000 floor is month 7; the first non-positive month-end is month 8. The old 10-month ratio does not describe this changed plan.
Compare the cases below. The slower-collections case receives $30,000 each month instead of $50,000 and keeps the same hiring and one-off payment. These fixed scenarios are examples, not predictions or recommendations.
Planned hiring: first month-end below the floor is month 7; first non-positive month-end is month 8.
| Month | Opening cash | Collected | Operating paid | Other paid | Closing cash |
|---|---|---|---|---|---|
| 1 | 600,000 | 50,000 | 110,000 | 0 | 540,000 |
| 2 | 540,000 | 50,000 | 110,000 | 0 | 480,000 |
| 3 | 480,000 | 50,000 | 130,000 | 0 | 400,000 |
| 4 | 400,000 | 50,000 | 130,000 | 20,000 | 300,000 |
| 5 | 300,000 | 50,000 | 130,000 | 0 | 220,000 |
| 6 | 220,000 | 50,000 | 130,000 | 0 | 140,000 |
| 7 | 140,000 | 50,000 | 130,000 | 0 | 60,000 |
| 8 | 60,000 | 50,000 | 130,000 | 0 | -20,000 |
| 9 | -20,000 | 50,000 | 130,000 | 0 | -100,000 |
| 10 | -100,000 | 50,000 | 130,000 | 0 | -180,000 |
Negative balances indicate a projected funding gap. They do not mean the business can actually keep paying from an empty bank account. Month-end values can also hide an earlier shortfall within the month. When cash is tight or receipts are uneven, review a shorter payment calendar.
The blank Excel worksheet supplies a 12-month structure and one worked formula row for a spreadsheet. It does not automatically choose assumptions or payment dates. Review the imported formulas and extend the rows before using it for your company.
4. Turn the forecast into decisions.
Name the assumptions that drive the cash crossing: collections, hiring, an annual bill or a funding date. Compare a plausible slower case with the current plan. Review which actions are available, how quickly they affect cash and what they change about the business.
The timing of a change matters. Moving a hire by a month has a different effect from reducing costs immediately. A payment already committed may remain due even if the team changes its plan. Record the cash date and the decision deadline, rather than assuming every cost can disappear next month.
Set a review cadence that fits the cash movements. Reconcile actuals to the forecast, explain the variance and revise future assumptions. Agree who owns the forecast and what event requires an earlier review. The floor is useful only if it prompts a decision while there is still time to act.
Copy a cash review note
AS OF: 30 September 2026 (fictional)
AVAILABLE CASH: USD 600,000; excludes USD 60,000 unavailable cash
CHOSEN CASH FLOOR: USD 100,000, inside available cash
SIMPLE ESTIMATE: 10.0 months at USD 60,000 monthly net cash burn
CURRENT PLAN: USD 50,000 monthly collections; payments rise from USD 110,000 to USD 130,000 in month 3; USD 20,000 one-off in month 4
NO NEW FUNDING CASE: First month-end below floor in month 7; first non-positive month-end in month 8
SLOWER COLLECTIONS: USD 30,000 monthly; below floor in month 6 and non-positive in month 7
REVIEW NEXT: Confirm collection dates and planned hiring before approving new commitments
OWNER / NEXT REVIEW: Replace with your owner and date
Fictional example. Replace the figures and check the supporting records.
Download the review note ↓A concise investor update can use the as-of cash, burn definition and relevant scenario. Do not publish the historic ratio as the current forecast when spending has already changed. Link the underlying assumptions in the supporting material so that the reader can understand the difference.
Review the cash plan in ModelLab when your account has access.
The Financial Model, also called ModelLab, has limited internal account access in the implementation checked on 3 October 2026. Other accounts see “coming soon”; buying a plan is not a promise of access. The article’s calculator and downloads remain available without ModelLab.
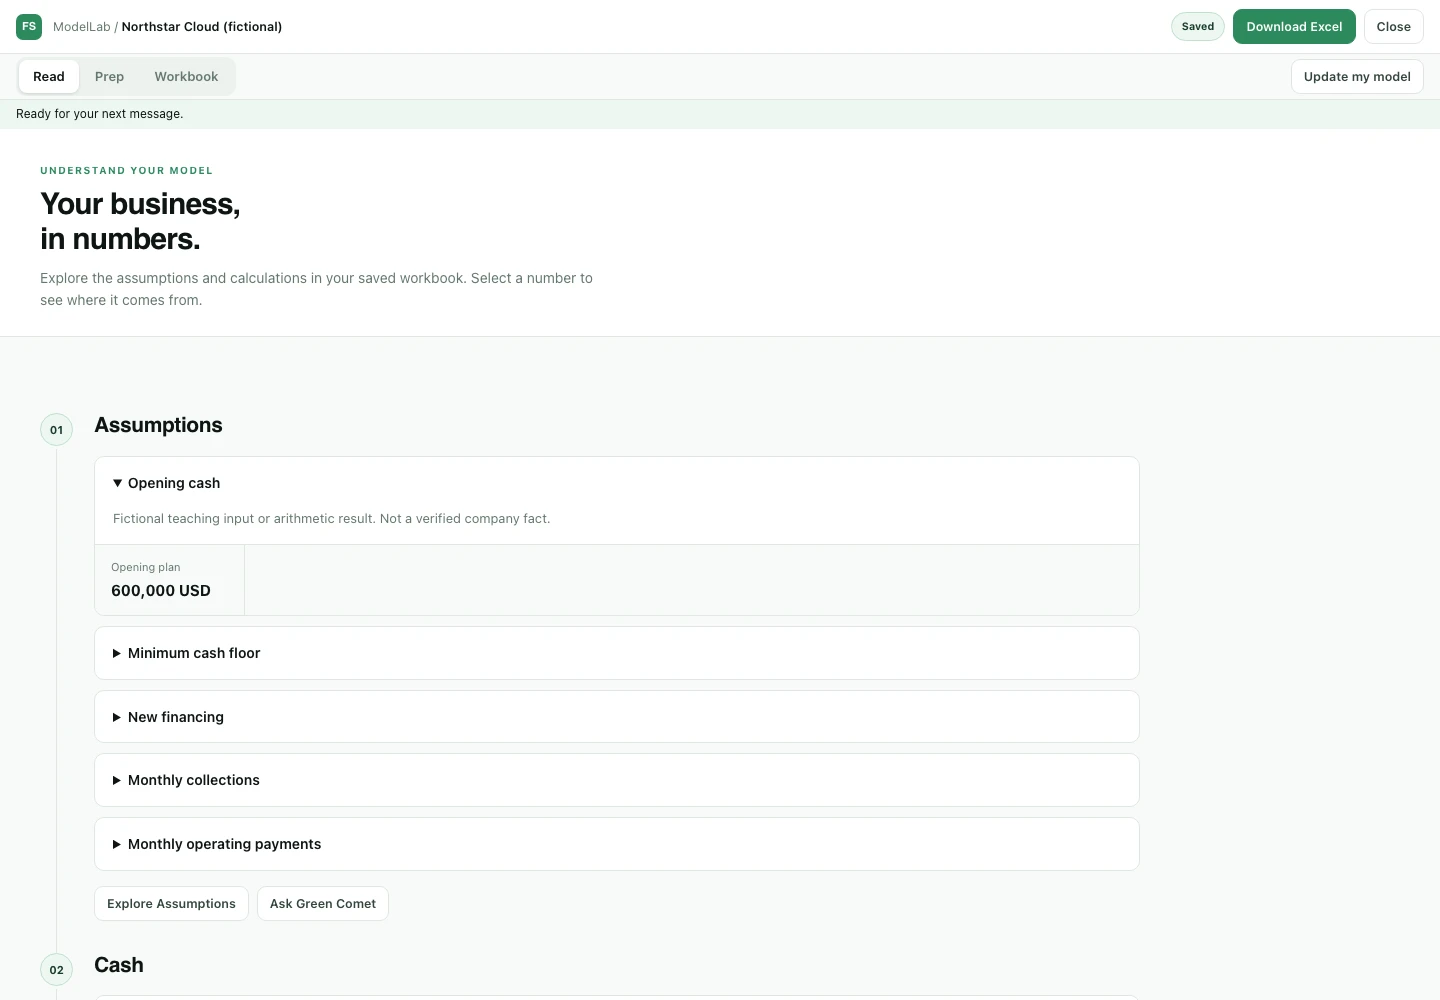
The following screenshots show the current interface with a fictional local cash plan and simulated read-only service responses. They match the constant-burn example above: $600,000 opening cash, $50,000 monthly collections, $110,000 monthly operating payments, a $100,000 floor and no new financing. They do not demonstrate a real account, provider build or verified company evidence.
1. Open your model and review the cash assumptions.
For an account with access, choose Open my model, then Read. Confirm opening cash, collections, operating payments and planned funding separately. A financing assumption is not money already in the bank. Keep the no-new-funding case as a distinct scenario when checking how long current cash lasts.
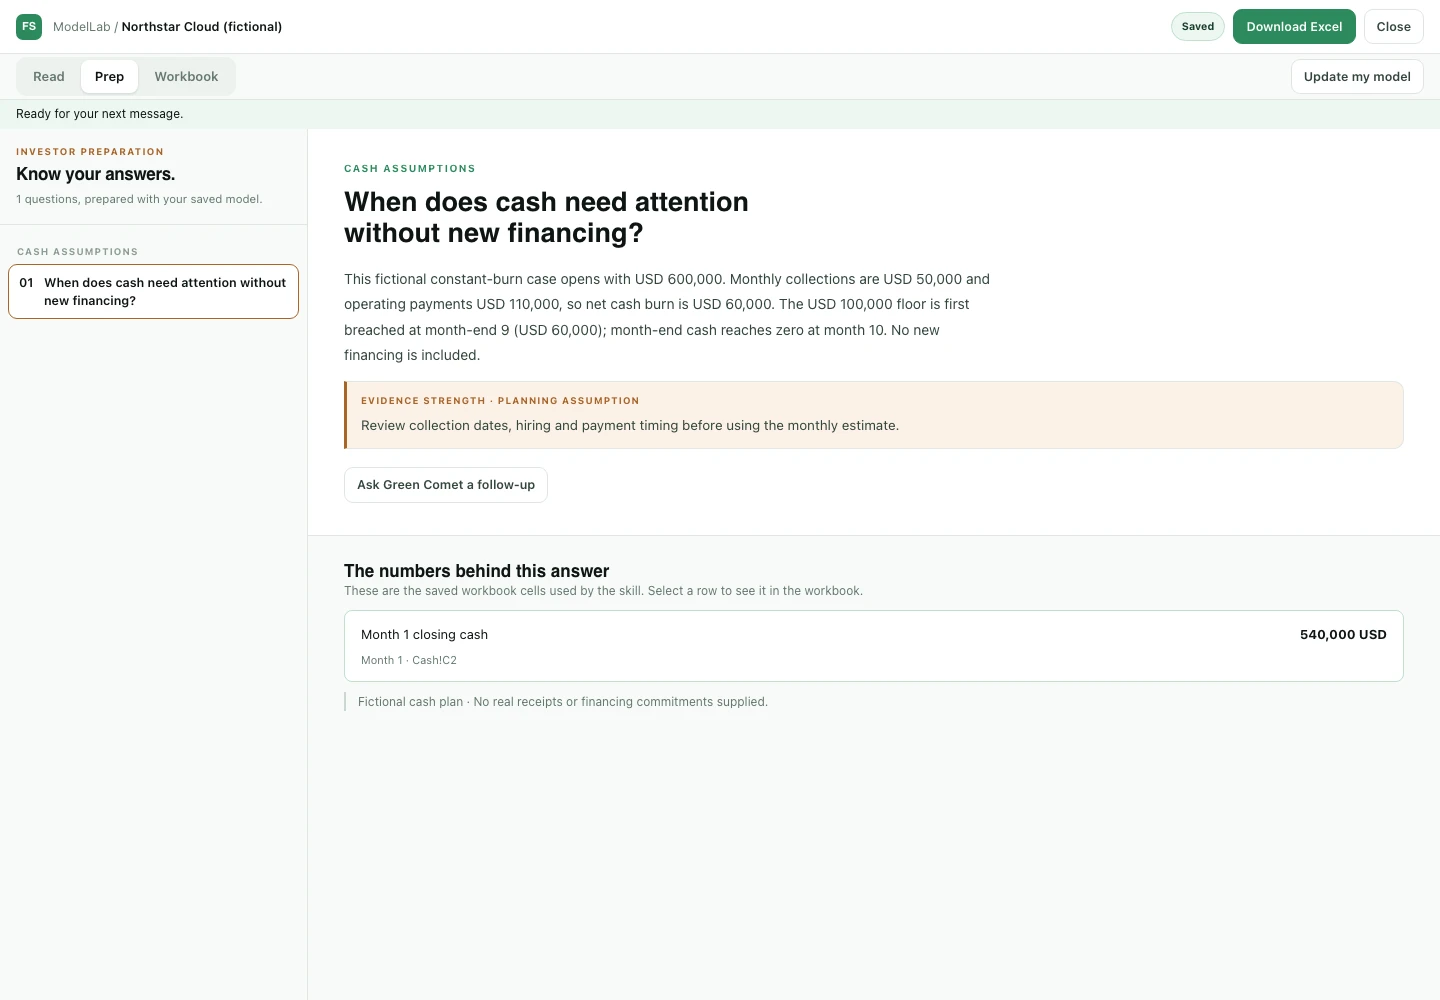
2. Use Prep to review the assumptions behind the answer.
Open Prep and review the cash-planning question. The illustrative answer identifies month-end 9 as the first balance below the $100,000 floor and month-end 10 as zero cash. Review the source and evidence notes. A model answer can explain its calculation without establishing that a customer will pay on the assumed date.
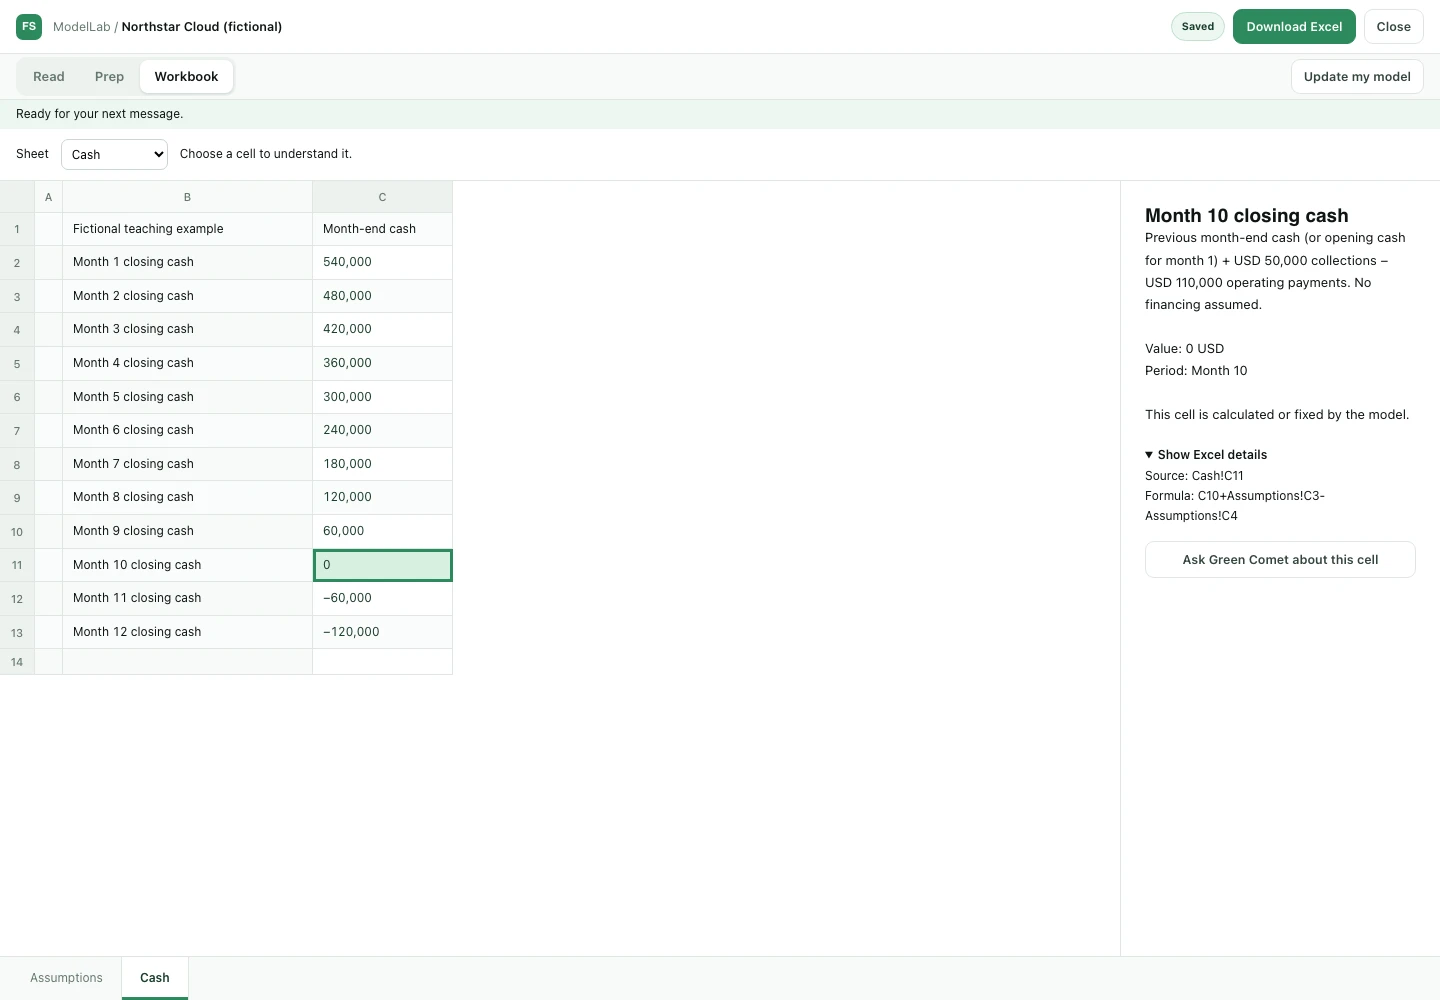
3. Inspect the monthly cash rows and keep the export consistent.
Open Workbook and select the relevant cash sheet. Choose a balance cell to read its explanation, then Show Excel details to inspect the source and formula. Here, the Cash sheet is an illustrative fixture, not a guaranteed sheet name in every generated model. Check the whole monthly sequence and any payments within the month.
Use Update my model to describe a changed assumption. Review the resulting model version and cash rows before sharing. The current interface offers Download Excel; a screenshot of that button does not prove a completed export. Confirm the downloaded file matches the reviewed version and preserve its assumptions and date.
If the model page shows “coming soon”, use the public worksheet. There is no existing ModelLab public preview to embed here.
Before using the runway number
Selections stay on this page and reset on reload. Completing the checklist records your review, not verification of the bank or model.
0 of 8 reviewed
Common questions
Should runway use gross burn or net burn?
For the simple depletion estimate here, use positive net operating cash burn: cash paid minus cash collected. Gross cash payments alone describe spending without the offset from collections. Include other material cash movements in the monthly forecast and state exactly what your reported burn includes.
What if burn is zero or negative?
The constant-flow ratio does not produce a finite depletion period when collections cover payments. Review the forward calendar anyway: seasonality, delayed collections, investment and repayments can still lower cash.
Can I include a planned funding round?
Show it in a separate financing scenario with an explicit receipt date. It should not increase current available cash. Compare that scenario with the no-new-funding case and explain what happens if the timing changes.
Does 10 months of runway mean I can wait 10 months to act?
No. It is a constant-flow estimate to zero, under stated assumptions. Your chosen floor, actual payment dates and the time needed to change the plan can require an earlier decision. Review the cash calendar and decision deadlines.
Sources and further reading
Sources reviewed on 3 October 2026. Arithmetic, worksheets and fixed scenarios are our independently calculated educational examples.
- Carta: Startup metrics and KPIs, 23 January 2024. Supports the relationship between burn and runway; this article defines a specific cash basis for its calculations.
- Sequoia Capital: Extending Your Runway, 14 June 2022. Historical presentation on breaking down runway and cash planning. Its 2022 financing environment is not presented as current market evidence.