
Show how the plan produces the numbers.
Before a seed round, a useful financial model should connect explicit assumptions to revenue, delivery costs, hiring, operating expenses, cash movements and financing needs. It should distinguish actuals from forecasts, explain the main drivers, and compare scenarios that change the decisions you would make.
The model helps you answer practical questions: what must happen to deliver the revenue plan, what resources that requires, and what happens to cash if progress is slower. It supports the fundraising conversation and the operating plan. A spreadsheet with precise numbers does not make uncertain assumptions true.
The structure below is our review framework, not a mandatory investor template. YC’s seed fundraising guide connects the amount raised to a credible plan and suggests considering different funding outcomes. It does not make every company’s financing needs identical. Choose a model that represents your business and the questions under discussion.
1. State the model’s scope before the forecast.
Put the company, entity, reporting currency, as-of date, actuals cutoff and forecast start in a place a reader can find. Name the planning horizon and time intervals. Use enough monthly detail to represent near-term hiring, collections and material payments, then choose a longer-term summary that fits the decision.
There is no universal number of forecast years in this guide. More columns can create the appearance of confidence without adding useful evidence. If the company is pre-revenue, say that clearly and show the assumptions that would lead to the first paying customer.
Include a short model map and version note: where assumptions live, which outputs matter, what changed and who reviewed the file. If the deck says “next year,” make the model’s corresponding dates explicit. A rolling forecast year beginning in October is different from a January-to-December reporting year.
Start with one decision: “Can this hiring and product plan reach the next milestone under the cash available or proposed funding?” Then identify the evidence needed to answer it.
2. Give each important assumption a unit and a source.
Keep inputs separate from formulas. For each material driver, record its value, unit, period, source, confidence and owner. Label a management estimate as an estimate, a historical measurement as an actual, and a target as a target. Do not describe a plan to acquire customers as customer demand already observed.
| Driver | Definition to make explicit | Evidence or question |
|---|---|---|
| Price | Per customer, seat, unit, order or project; monthly or annual; currency. | Current contracts, price tests or an unverified intended price? |
| Volume | New and retained units, start date and delivery capacity. | Observed conversion or a forecast that still needs testing? |
| Retention | Customer churn, revenue churn or repeat buying; measurement period. | Which cohort and which definition support the rate? |
| Hiring | Role, start month and total employer cash cost. | Known offer, recruiting estimate or a discretionary plan? |
| Collections | Invoice timing, cash receipt timing and assumed delays. | Existing payment behavior or a proposed commercial term? |
| Funding | Amount, cash receipt month, fees and conditions. | Available cash, agreed financing or a future possibility? |
Use the model to reveal unknowns. If pricing has not been tested, record that gap and show how the result changes at another price. A benchmark can inform a question, but it should not silently become your company’s achieved conversion rate or retention.
3. Build revenue and costs from the actual business.
Revenue: connect volume, price and timing.
For a subscription business, separate opening customers, new customers, churn and pricing. Explain when new customers start paying and whether billing is monthly or annual. For services, connect billable capacity, utilization, rate and delivery timing. For a marketplace, distinguish transaction value from the company’s revenue. A licensing business may need individual deal and payment events.
Start with the smallest driver model that represents the business faithfully. If a capacity limit, contract step or price tier matters, include it or state the limitation. Do not make the forecast fit a simple template by dropping the mechanism that drives the result.
Delivery costs: define what it takes to earn that revenue.
Identify the costs directly associated with delivering the product or service. Keep the unit consistent with revenue: cost per customer-month differs from a one-time onboarding cost. Explain gross profit and margin using the categories included in the model.
People and operating costs: show dates, rather than only annual totals.
List roles, start and end months, compensation and relevant employer costs. Separate delivery personnel from sales or overhead where that distinction matters. Put recurring expenses, growth assumptions, annual bills and one-off costs in explicit schedules. Review what is already committed and what the team could change.
A model that increases revenue without the staff, infrastructure or acquisition work required to support it leaves an important assumption hidden. The reverse also matters: hiring someone does not automatically create a corresponding sale.
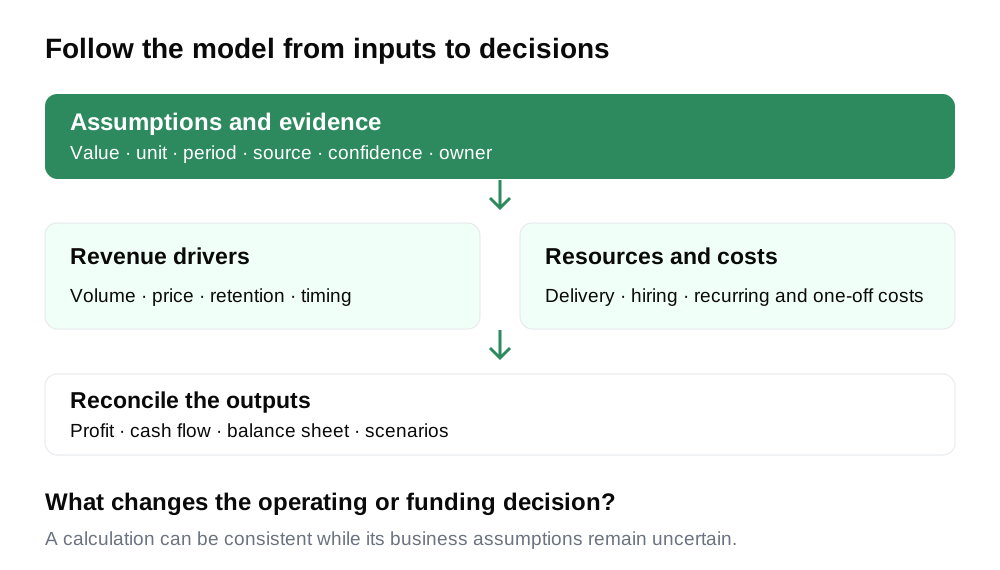
4. Connect the operating plan to cash and the balance sheet.
The income statement explains revenue and expenses for the period. The cash flow view explains cash received and paid. The balance sheet explains the resulting assets, liabilities and equity at a date. In a linked model, these views should agree under the assumptions used. The SEC’s financial statement guide explains these basic distinctions.
Where relevant, include collections, supplier payment terms, inventory, capital purchases, debt payments and taxes. Distinguish spending recognized as an expense from cash used to buy a longer-lived asset. Confirm the treatment appropriate to the business rather than applying an unexplained shortcut.
Separate the no-new-funding case from a case that assumes a raise. If the forecast depends on financing, record the receipt date and show the effect of a delay. Keep cash runway, the chosen operating floor and the milestone plan together. The runway guide explains why a constant burn ratio can differ from a changing monthly cash schedule.
Check that cash rolls from one period to the next, that assets equal liabilities plus equity, and that opening balances agree with the source records. A balance sheet that balances because of an unexplained balancing entry has not answered the underlying question.
5. Trace a fictional one-month example.
Northstar Cloud starts a teaching month with 100 customers and $600,000 cash. Assume 1% of those customers leave before billing, and four new customers join at the start of the month. All 103 closing customers receive a full month of service at $1,000. This timing is deliberately simplified; a real business may need prorated starts and more detail.
Recognized revenue is 103 × $1,000 = $103,000. Delivery costs are assumed to be 25% of revenue, or $25,750. Payroll is $45,000 and other operating expenses are $15,000. The simplified operating profit is therefore $17,250, before any items excluded from this example.
Only $85,000 is collected during the month, while all $85,750 of expenses are paid. Cash falls by $750 to $599,250. With no opening receivables or other changes, the unpaid $18,000 remains receivable. Cash plus receivables equals $617,250: opening equity of $600,000 plus the $17,250 profit. This simplified example excludes debt, tax, capex, depreciation and other assets or liabilities.
Compare a cautious assumption set with two new customers and $70,000 collected. Pricing, churn, cost percentage, payroll and other expenses stay the same. Each number below can be traced to the stated drivers.
Base assumptions: operating profit is $17,250, but operating cash falls by $750. These are different measures.
| Measure | Value | Driver or explanation |
|---|---|---|
| New customers | 4 | Joined before the month’s billing |
| Closing customers | 103 | 100 × (1 − 1%) + new customers |
| Recognized revenue | 103,000 | Closing customers × $1,000 |
| Delivery cost | 25,750 | 25% of recognized revenue |
| Gross profit | 77,250 | Revenue less delivery cost |
| Simplified operating profit | 17,250 | Gross profit less $45,000 payroll and $15,000 other expense |
| Cash collected | 85,000 | Independent receipt timing assumption |
| Operating cash paid | 85,750 | All costs paid in this teaching month |
| Operating cash change | -750 | Collected less paid |
| Closing cash | 599,250 | Opening $600,000 plus cash change |
| Closing receivables | 18,000 | Recognized revenue not yet collected |
| Assets and equity | 617,250 | Closing cash + receivables = opening equity + profit |
These are two complete assumption sets, not a probability forecast. They illustrate why slower acquisition and collections can change both earnings and cash. They do not establish that either outcome is likely.
6. Review scenarios and explain the forecast.
Change the assumptions that could alter your next decision. Slower customer acquisition, delayed collections, different pricing or a revised hiring date may be more useful than applying the same percentage change to every row.
Sequoia’s forecasting and scenario planning presentation provides a historical discussion of planning under uncertainty. Use that context to ask which assumptions and decisions matter for your company; its 2022 market setting is not a description of today’s funding conditions.
For each scenario, record what changes, what stays fixed, the cash or milestone implication, and the action it would prompt. Check how the assumptions interact. A slower sales case with unchanged aggressive hiring may be intentional for comparison, but it needs to be named.
Copy a model review note
MODEL / VERSION: Replace with the file and revision
AS OF / ACTUALS CUTOFF: Replace with dates
ENTITY / CURRENCY / PERIOD: Replace with the model context
DECISION: Which operating or funding decision does this model support?
KEY DRIVERS: Customer volume, price, retention, delivery cost, hiring and collection timing
EVIDENCE GAPS: Which assumptions remain unverified, and who will test them?
BASE / CAUTIOUS CASES: Record the changed assumptions and resulting cash or milestone implication
FINANCING: Separate available cash from expected proceeds and their timing
RECONCILIATION: Confirm source actuals, statement links and opening-to-closing cash
REVIEWED OUTPUT: Name the workbook version and the main source cells
NEXT ACTION / OWNER / DATE: Replace with a concrete review task
Copy this structure, then add your own reviewed facts and assumptions.
Prepare to explain the largest drivers in plain language and point to the source cells. If the investor asks what happens when an assumption changes, discuss both the numerical result and what you would actually do. Keep the model, deck and funding ask consistent in date and scenario.
Use the current ModelLab views to review the reasoning.
ModelLab currently has limited internal account access in the implementation checked on 3 October 2026. Access is checked by the platform. A paid plan does not promise that the tool opens for the account. The public examples and downloads above do not require ModelLab.
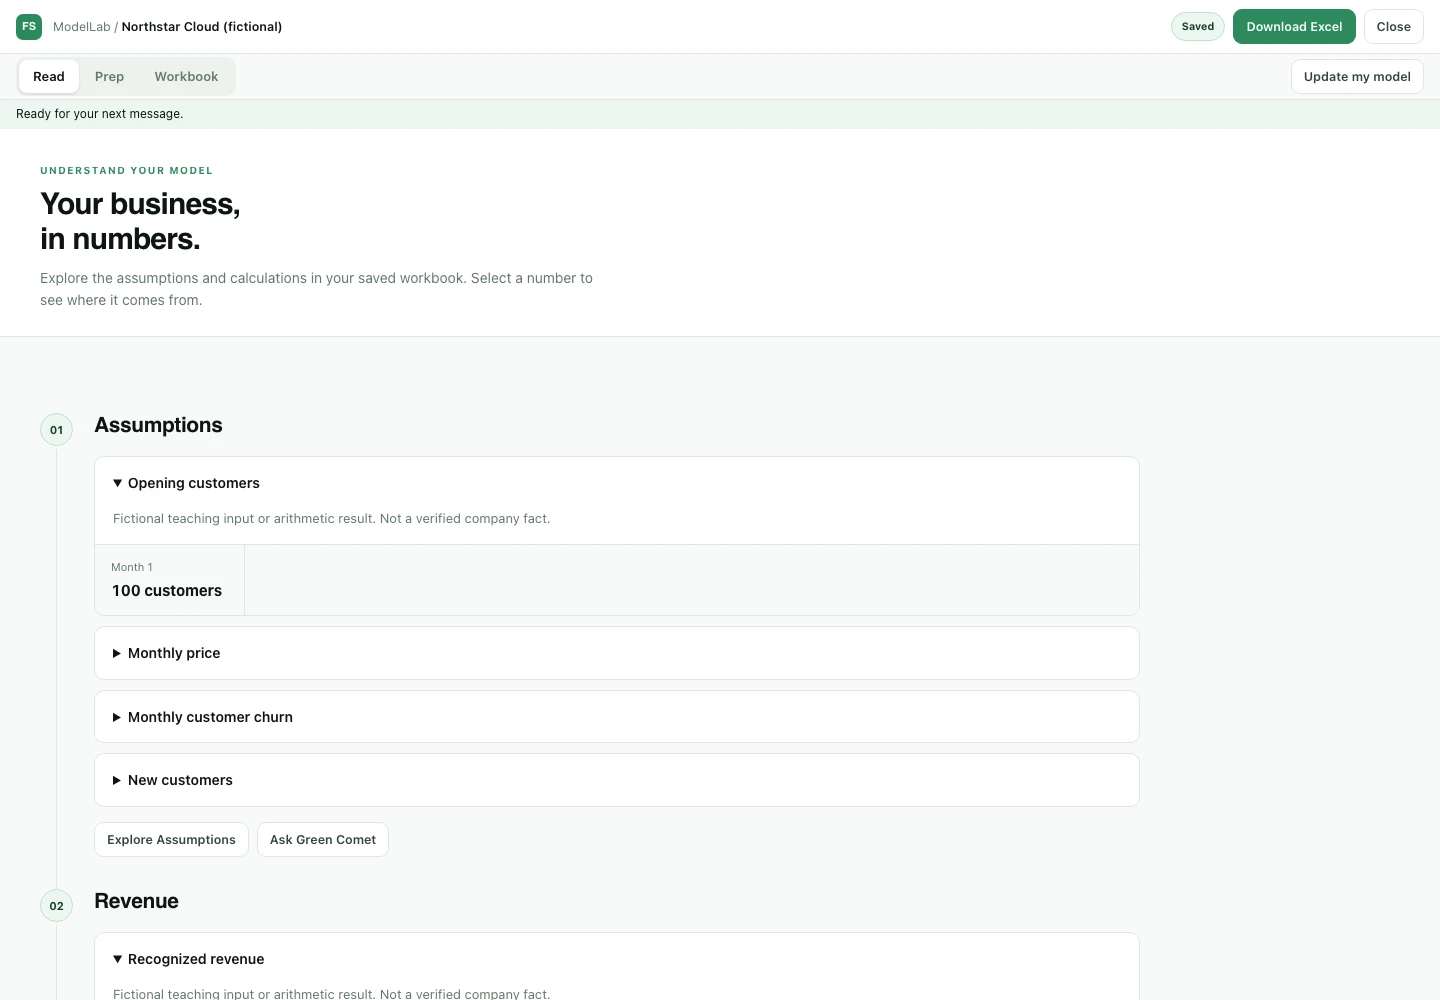
These screenshots show the current interface running locally with the fictional teaching values from this article. The saved session, workbook view and explanations were supplied by a capture fixture. No provider build, accepted customer workbook or real account operation occurred. The figures demonstrate how to inspect the interface, not the quality of a generated financial model.
1. Read the figures with their period and definition.
For an account with a saved model, choose “Open my model.” The Read view groups workbook figures and explanations. Select a value to inspect its source. Review whether the definition and period match the plan you intended, and whether assumptions have been mistaken for evidence.
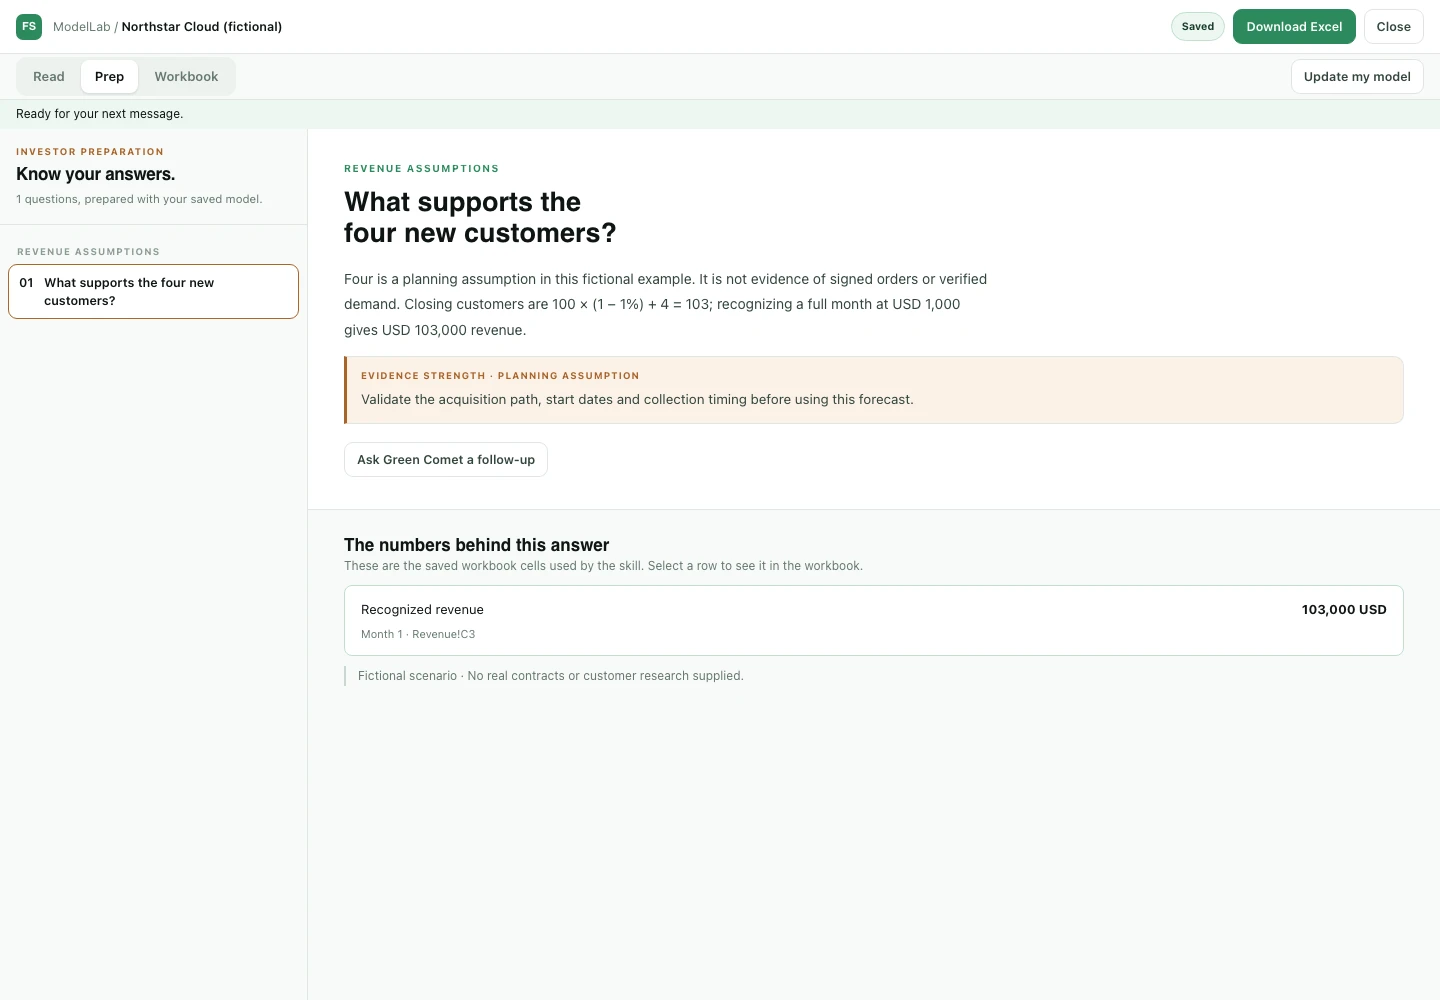
2. Check investor answers against their evidence.
Open Prep and select a question. Read the answer, its evidence assessment and the next action. In this example, four new customers is explicitly a planning assumption. An explanation of the arithmetic does not establish customer demand.
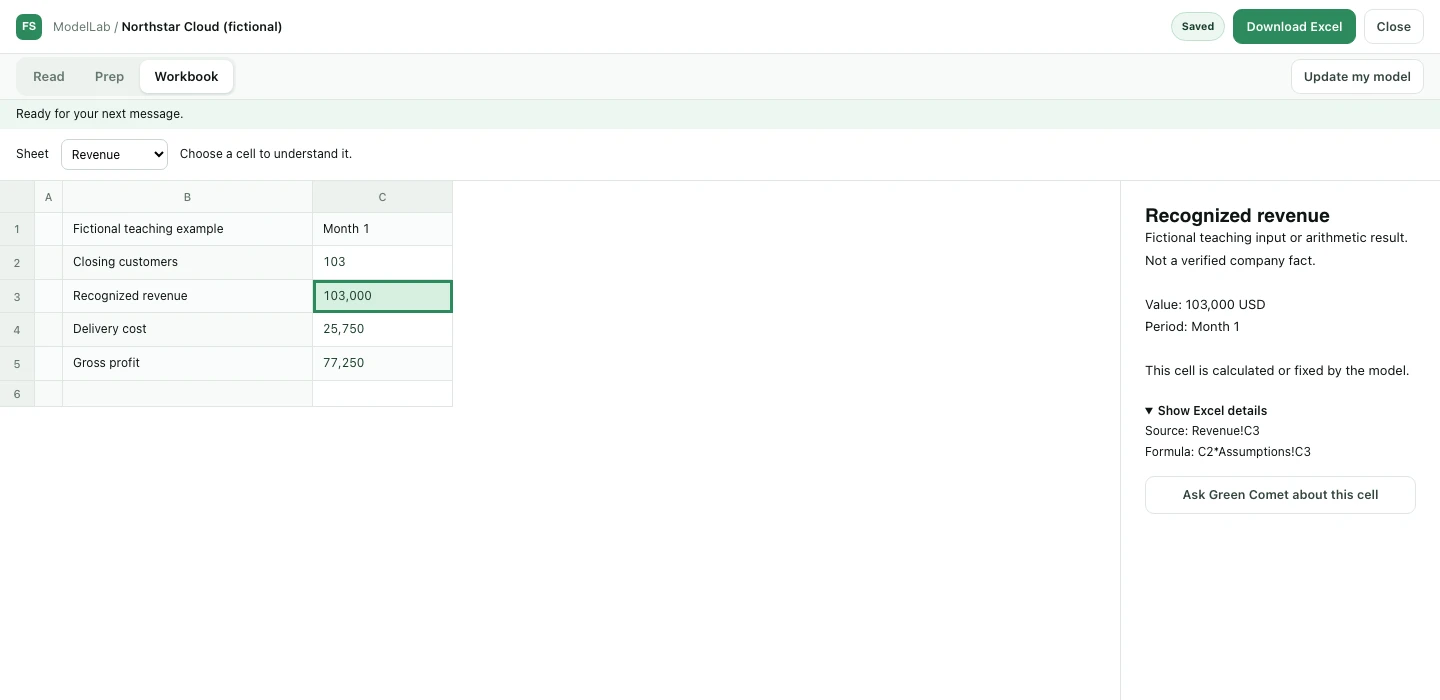
3. Follow a source into Workbook before updating or exporting.
Select an evidence row to open the Workbook view at its source. Review the selected cell, explanation, unit and period. Use “Show Excel details” when a formula or dependency needs checking. Editable inputs can be changed through the conversation using “Change this input” or “Update my model.”
Review the revised model before using “Download Excel.” Keep the exported file with the assumptions and revision discussed. The currently reviewed flow retains an accepted workbook while an update is being prepared; a running request is not proof that the new output is ready.
Model types and outputs should fit the specific business. Ask for important timing, capacity or contract mechanics explicitly, and review what the delivered workbook actually represents. Do not assume that a requested feature or a successful calculation check guarantees faithful business modeling.
There is no existing public ModelLab preview to embed here. The article’s case comparison supplies a public example without changing account access. Recheck availability and the real build/export flow before releasing this draft.
Before sharing the financial model
Selections stay on this page and reset on reload. They record your own review and do not inspect a workbook.
0 of 8 reviewed
Common questions
Do seed investors all require the same model?
No. The useful level of detail depends on the business, stage and investor process. This guide supplies a review structure; confirm the requested outputs and keep the operating assumptions explainable.
What should a pre-revenue company include?
Label the absence of revenue clearly. Model the customer, product and delivery assumptions that would lead to revenue, plus the resources and cash needed to test them. Distinguish research, pilots and intentions from achieved paid sales.
Does a balanced model mean the forecast is correct?
No. It shows a particular set of calculations is internally consistent. Unsupported customer growth, incorrect collection timing or an omitted obligation can still make the forecast misleading.
Should I build scenarios or just one forecast?
Use scenarios when uncertain assumptions change a decision. Name the drivers that change, the result and the action. A scenario label alone does not describe the risk or make an outcome probable.
Sources and further reading
Sources reviewed on 3 October 2026. The review framework, registers and one-month examples are our educational work. The financial statements shown are deliberately simplified, not a substitute for the company’s records.
- Y Combinator: A Guide to Seed Fundraising, 7 January 2016. The plan and funding-outcome discussion informs the framing; historical fundraising ranges, costs and market assertions are not used.
- Sequoia Capital: Forecasting & Scenario Planning, 14 June 2022. Historical planning context, not current funding-market evidence.
- SEC: Beginners’ Guide to Financial Statements, 4 February 2007. Basic statement definitions and the balance sheet equation; this article does not prescribe public-company reporting obligations for startups.